This post may contain affiliate links.
Stef and I have been rolling with VB Air Suspension in our RV for over a month now, and there’s no going back. We’re hooked!
We made a before-and-after video right when we got it installed, and we both thought it improved the ride quality for us. But that was a pretty subjective test. Since I’m me, I had to go a little further with it. I wanted actual data to prove that things really were smoother. The result is this video:
To do this right, I needed three things:
- A control rig and our rig, together on the same day
- A bumpy road
- A way to quantify ride quality
The first one was pretty easy. Right after we left Advanced RV, who had installed the VB Air Suspension on our ProMaster, we headed to Winnebago’s Grand National Rally. While we were parked there in a row of 40 or so nearly identical rigs, I realized I had found my control rig! I searched around the row until I found a similar Travato with stock suspension. Our RV is pretty unique, but the Soloway’s RV was as close as practical. They were nice enough to let us use their rig for our video.
Finding a bumpy road was also pretty easy. Stef and I led bike rides all throughout the rally. I just paid close attention and found a straight section of road with plenty of expansion joints, cracks, potholes, dips, and bumps. It didn’t take long to find our test track, just outside the rally grounds.
Finding a way to quantify ride quality took a little more thinking, but ultimately the answer was in my pocket. Modern smartphones have accelerometers in them. These are what lets the phone know if you tip it, shake it, whatever. So I found an app that tapped into the phone’s accelerometer data, and displayed that in a graph. In practice, it looks like a seismograph. The app I used is called “Vibration”, for the iPhone. The important thing here was that it let me export the data so I could look at it afterward.
Once I had those things in place, you can guess how the experiment worked. We drove each van, loaded with the same passengers (and same driver) over the same bumpy road at the same speed and recorded the data. We also had the Soloways give us their impressions of the ride quality. Since they hadn’t spent the money on an air suspension system, we figured their opinions were bound to be less biased than our own! And when we got back home, I took a long look at the data and produced the analysis you see in the video.
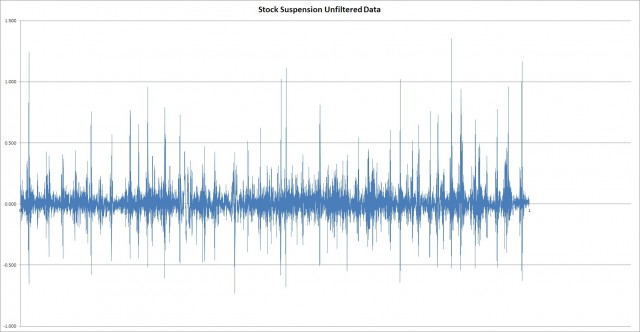
As I promise in the video, here are the graphs. First up is the unfiltered data from the van with stock suspension. (You can click on these to make them bigger.)
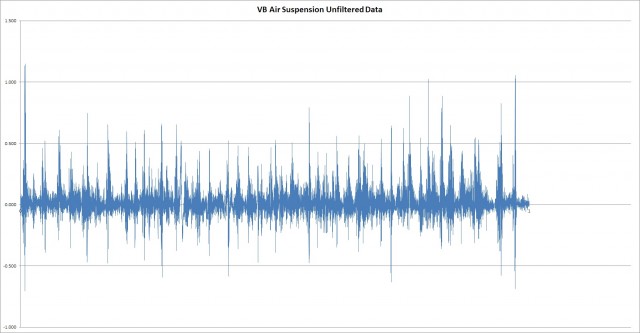
And here is the same road in our van with VB Air Suspension. This is also the unfiltered data.
What I like about those two graphs is that you can really tell that we’re on the same stretch of road, and hitting the same rough spots in the pavement. You can also start to see that the VB Air Suspension graph is less… “hairy” than the stock suspension. Look at the number and magnitude of the peaks and you’ll see what I mean.
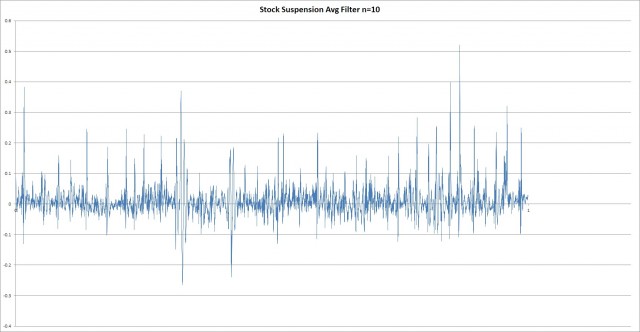
Then, in an effort to separate the signal from the noise, I applied a simple filter. I describe this in the video. When I had done that, you can really start to see the differences. First up is the stock suspension.
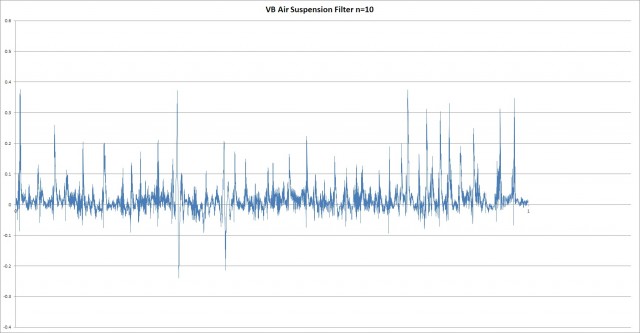
And now the VB Air Suspension.
With the higher frequency noise filtered out, the data starts to look much more convincing.
So now that you have the data, ask yourself, which van would you rather be riding in?
I did ask myself that question! Not only do I ride in the van, but I have to work on a laptop on the dinette while Swervy McWhiplash (aka Stef) is driving. The end result of all this is that I’m convinced that the VB Air Suspension did indeed smooth out the ride. Stef and I felt it. Ms. Soloway certainly felt it. And now, I’ve got data that shows it.
I’m considering this case closed, and a verdict in favor of the VB Air Suspension. But I’m interested in your thoughts. You folks are my “peer review”! Sound off in the comments below and let’s hear it!







Hi James, is the raw dataset available for download? I’d love to run it through Matlab. I’m based in the UK and considering getting the same suspension upgrade for our van. Thanks for the interesting videos!
Unfortunately, no. I looked, and it seems the only place I had the files stored permanently was on my phone… which I’ve since replaced. If I do find it, I’ll post back, but don’t get your hopes up.
Hello,
We have a Panoramic RV (canadian manufacturer) based on a Promaster 3500. We installed Michelin LTX M/S tires. When we drive on wet grass or ground with mud, we lost the tracker of the front wheel. Do you think, using a VB air suspension, if we up the back of the RV et down the front, changing the pressure , we could change the weight distribution (back to front) and have more track on the front tires?
Thank you very much
Regards
While you might have a little ability to “tip” your rig with the VB suspension, that’s really not what it’s designed for.
Thank you for your answer.
according to you, what would be the best solution to improve traction on the front wheels. For your informatiom I installed sumo front and back following your excellent video. thank you in advance.
If one day you are in Quebec City, just let me know, it will be a pleasure to show you around.
Regards
Any chance you could publish the data here on your website?
PS: “Swervy McWhiplash” cracked me up!
You mean like the raw data that went into the graph? Yikes. That’s over two years old now. I’d have to find it, and I’m not exactly sure where it is – I probably archived it off with the video. If it’s really important to you or if you had an idea for some really cool analysis, let me know and I can try to find it when I’m back in the country.
I was wondering if you ever looked into vortex generators or air tabs. Many over the road truckers use this and also many rv’s. This could be an inexpensive method of stabilizing your drive.
Thought about it, but two things held me back.
1. couldn’t get past the silly look of the things.
2. without a wind tunnel capable of housing the van, I wouldn’t have anything concrete in the way of before/after. So any results I got would be subjective seat-of-the-pants kinds of feelings.
I thought of using yarn to visualize the airflow, but that would still be sort of subjective. (Visually interesting, but not hard data.)
Hi James and Steph!
We were hoping to see you in Tampa this weekend, but unfortunately weren’t able be there when you guys were.
After a year plus with the VB suspension, do you both think that it would help with a front seat passenger who tends to get a little motion sickness in the ProMaster?
We’re going to get the leveling system installed at Advanced RV in the spring, but have been contemplating getting the VB, with the big hope that it helps with my wife’s motion sickness.
Hi David! Where I notice the VB suspension improvements the most is when I’m either sitting at the dinette behind the front seats or when I’m in the back of the coach… MUCH smoother in both those places even compared to sitting up front! Up front, the feel doesn’t seem as significant of a change from before, though I’m not sure maybe it is. It’s been so long since I rode in a ProMaster without it I’m worried I’ve just forgotten!
I don’t remember seeing this information posted anywhere so apologies if it is, and I just didn’t see it. How did the VB system affect your total cargo weight capacity? Did it increase it, decrease It, or was it roughly a wash? I ask because it seems like there might be a not insubstantial weight to the system itself. But if it increases the overall capacity that would be a big plus in considering the system.
It was basically a wash.
It couldn’t be expected to increase the capacity, because that rating can only come from Ram.
We removed some fairly long leaf springs, and replaced them with airbags, arms, compressor, etc.
Maybe I lost 100 pounds of capacity. I’d guess that’s about it.
Thanks for the quick reply! Ironically I’m sorry I didn’t say it sooner.
Hi James – What are your thoughts about the VB system after the first year? Any system failures or fixes so far? When looking at your install I was wondering about road breakdowns due to rocks damaging hoses under the RV while driving at highway speeds. If there was a breakdown are there many places that could fix the system? Thanks, Roger
After more than a year now, the VB system is working great. No system failures or fixes. We have had a couple events where we needed to “reset” the system. (That’s what I call it. I don’t know what the technical term is.) This would be after we’ve done weird things like turn the vehicle on and off several times, perhaps while in gear, and try to put the landing gear down… that kind of thing. I guess we “confused” it a time or two. But we’ve always been able to get it operating normally again.
Would I do it again? Heck yeah!!
Hey James,
Based on an old recommendation from the Fit RV, and recommendations from others, my wife and I recently purchased the front and rear Sumo Springs. I just saw this latest post – which I wish I’d read before buying these Sumo Springs. Anyway… I assume you took the Sumo Springs off when you installed these air shocks. Did you ever put the front Sumo Springs on your van? Did you ever have any problems / regrets putting the Sumo Springs on your van?
Many on the RT Zion forum praise the Sumo Spring for improving ride height and improving ride comfort. I read your note on them and you only referred to improving ride height and no degradation in ride comfort.
Long story short is I’m either going to take them to a local spring shop to have them put on, or I’m going to return them. I just thought I’d see if you had a minute to offer some advice before I do either.
Thanks,
keith
Yes, we did take the Sumo Springs off when adding the air suspension. We really had no issues or regrets with the Sumo Springs. We just upgraded.
We never purchased or installed the front Sumo Springs, so I really can’t comment on that.
In addition to the Zion forum, the Travato Owners and Wannabes group on Facebook generally give the Sumo Springs a thumbs up. I’ve never heard of *anyone* who has had a negative experience or regrets putting the Sumo Springs on their ProMaster at all.
In your position, I’d go ahead and get them installed.
(It’s completely reversible, if you decide you don’t like it.)
How did the VB air suspension change the handling on the highway with trucks passing or driving into driveways that have good slopes? Thanks
Hi Roger –
Due to being front wheel drive, we already thought our ProMaster handling passing trucks really well. With the VB Air Suspension, the passing trucks are a non-event.
We haven’t driven into too many steep driveways, personally. The VB system has a ride height sensor in the back, and it is programmed to keep the rear elevated (even when loaded) so that it rides in a slightly nose-down attitude. Given that, I would have to say that the approach angle is improved, especially if the back is loaded.
Thank you, James – I have one more question that I forgot to ask. Can you use the VB air in the back for leveling the RV front to back and if so how how many inches? Thanks again,
Roger
Yes – you can add and remove air from the VB suspension system to act as a front-to-back leveling system (while parked only). You can get a few inches this way. I haven’t measured it, but I think it may be in the 3-4 inch range. It’s not an individual control though, so you can’t level side-to-side. But that is another benefit of the VB system.
I believe you got Koni shocks with the suspension mod. If so, much of your improvement is due to the better shocks and improved damping.
I also think your data rate of 100 Hz is too small to calculate an effective FFT. Traveling at 30 mph, you could be missing some of the bumps or their peaks (data rate is too slow).
Actually, we still have the factory shocks, so there’s no change there.
I played around with FFT a little bit, but figured it was probably going overboard…
Hi, Thanks for the great video. If you look at the gentleman standing in the back he is leaning with both hands on the counter that your phone was on. I dont think that is a fair representation of the data even though he is doing it on both runs.
Interesting, but I doubt it’s significant.
The counters in both rigs were firmly affixed and have substantial mass. Any additional damping or excitation from Mr. Soloway leaning on the counter is going to be negligible.
AND, as you point out, it would be consistent from one run to another.
I think it’s well below the noise level for this kind of backyard science.
James and Stef: one of the other things the VB air is supposed to help with is ease of control in cross winds and in the “wash” of trucks as they pass. Have you any comments on this dimension pre and post VB air?
Mike, While I haven’t finish reading ALL of the comments/questions to this old ‘show’, I didn’t see a response to your question.
We have Suma installed on our Coachman Galleria MB extended. I have had some white knuckle experiences from cross winds and truck ‘wash’ which I am trying to eliminate prior to an anticipated cross country trip. DID you get a response and have you any added input/experience on this subject and potentially good suggestions for us? THANKS
Although not practical in your testing enviorment but what was needed and omitted was the weight comparison of the two vehicles. This would influence the results greatly.
Agreed. But each van was carrying the same number of adults, and all groceries and supplies for an extended road trip.
Without weighing them (which, as you point out, was impractical), that’s as close as we could get.
Appreciate this analysis, as a smooth ride is our Number 1 priority due to my back/neck issues and we both work on laptops. Planning to buy a Class B in the next few months and you’ve given us yet another great tool to compare besides our subjective observations! Your info ROCKS, pun intended….
Here’s to smooth travels for you in your new rig!
(BTW – we met “V” of VB last week at the Dusseldorf RV show! Super nice guy – very gregarious.)
James, I totally vote for the frequency domain analysis! There is an ISO standard for whole body vibration, ISO 2631 and for seat vibration, ISO 10326–1. Bruel & Kjaer make a triaxial accelerometer for measurement of such things; you might try contacting the closest B&K sales office to see if an interested FAE would like to make some measurements with you!
Lol! You seem more excited about it than I was!
I don’t think I’ll go much further with this data set. But…
If VB brings their 4-corner suspension to the US, we could do a before/after with that.
Fascinating, detailed analysis. Maybe a little over my head, but I love it.
All I can say is that:
1) we rode in a Sprinter WITHOUT VB,
2) we then rode in in one WITH It.
Clear and unequivable choice: VB Wins.
We chose that withput hesitation for our Advanced-RV.
Yes, it;s pricey, but worth it!
In the end, what you feel in the seat of your pants is really what matters!
Seems like you came to the same conclusion Stef did. (Without having to do all the experimentation.)
Glad you’re liking it. Us too!
SCIENCE!
Can you share web site fot Advanced RV you used and a contact name- thete seem to be several
After market shops with the same name.
Sure. They’re linked right here: Advanced RV – https://advanced-rv.com/
If you’re looking for a name there, Brittany would be the best person to ask for. She will be able to direct you to whomever you need.
James, I think the suspension mod is a luxury but I really liked you attacking the propane refrigerator to convert to a compressor unit. Now that is the ultimate mod. Why tolerate an archaic absorb tin system when compressor units are available. At this point, the only mod left is to attach an airfoil and make Lance airworthy.
Amen on the absorption refrigeration.
(Though, interestingly, that’s the ONLY kind of refrigerator we saw in Europe!)
Airfoils. Tracks. Floats. All up for grabs!
Though Stef has told me to take an expensive-mod-hiatus for a while.
Hmm, tracks… with 4×4 Sprinters already here (doesn’t Fiat have a Euro-spec Ducato?) An aftermarket track kit would open up a lot of Florida acreage to boondocking.
I am about to install the VB air system, and just learned the E&P levelers may be the only levelet option. I have an appointment at HWH a couple weeks after VB. I have the Helwig/Fox combo installed now on my 2018 Navion, and am pretty happy overall.. Can you reply privately with your true feelings about VB? You can use my FB or email. Need ASAP.
Why would you think I wasn’t being truthful? Should I be insulted?
Interesting analysis and after seeing your video on your initial assessment I got the impression yes the ride is better. But it did not come across as thousands of dollars better…..
Installed SumoShocks on my Zion SRT, Promaster 2500. This year’s 5000 plus mile trip compared to last year was a noticeable improvement in ride and handling. For a $300 investment well worth the money.
The Sumo Springs are a popular ProMaster upgrade. We had them as well, before the VB Air Suspension. In the “before” in the first video, we were riding on Sumo Springs.
We think the VB Air suspension is better, and takes that to the next level.
Is it worth it? That’s something everyone would need to decide for themselves.
But with as much as I work while Stef drives, I think it is for us.
Hey James! Love your geekiness. (Hi Steph!)
Here’s a question for you. If you don’t want to spend the bucks for a VB system, could you install Sumo’s and maybe better shocks for a similar-ish knocking down of the vibrations / events?
Best,
Alex
P.S. How much did you shell out for that fancy VB system?
We had Sumo springs before we installed the VB. The VB is better. You can see our first video on the VB Air Suspension for our before and after impressions on our own van.
Installed pricing on VB air suspension depends on several things. We certainly didn’t think it was inexpensive – it’s in the thousands. But you’d need to contact Advanced RV for pricing for your situation. For us, it was worth it.
I wouldn’t spring (pun intended) for the suspension change personally but an interesting analysis nonetheless.
From my uninformed perspective, based on your video and comments on forums, it seems like the stock suspension spring rate may be too heavy duty/stiff for the load, which may be consistent with what I assume is the standard heavy duty commercial suspension used on the larger versions of the Promaster? If this is the case then replacing with the medium or light duty leaf spring suspension components might also be an option subject to proper checks for gross vehicle weight etc.
The ringing oscillations on the large bumps that you point out look like under-damping to me. Although the “bump stop” was touching the spring on the stock suspension it seems from forum comments this is not unusual for Promasters, where the bump stop may barely clear the spring even in an unloaded van. It seems the bump stop is a component of the stock suspension and not just a “stop”.
Interesting thought about the bump stop. It certainly doesn’t seem like an active component of the suspension. Our seemed hard as rocks!
But then I didn’t design the suspension system myself, so who knows what they were thinking.
Hey guy’s a question… why didn’t you install 4C full air ???
It honestly didn’t occur to me. VB suggested that the rear suspension had a bigger impact on ride quality than the front, so we focused there.
⚖️⛏⚒⚙️⛓⚖️
Balance RV engineering is smoother Ride and pleasant experience. Good job Thank you!
I’d say the stock suspension performed pretty well, compared to the significant expense, complexity, and potential for future maintenance that one might experience with the air suspension. Considering that once you pay for the Travato, the stock suspension is “free,” this is a mod for those with excess money. Love your other mods, though!
It may not be for everyone, but for me, it was definitely worth it. Working while Stef is driving is now much less of a headache. (literally) 🙂
Hi James,
It seems to me that you’ve probably got enough info processed to see the highlights of the changes you are most interested in.
But, if you really wanted to dig in deeper, I’d suggest moving over to frequency domain.
That would make it easier to see stuff like impulse response, decay times and resonances after the impulse of a bump, changes to the overall spectrum and amplitude distribution, even when not bumping, etc.
Or compare the two frequency data sets in one graph.
No real need for it, but could be fun.
You may have an excel FFT function, if you have a math pack.
Otherwise there are good audio analysis programs to to all the hard work. A good free one is Audacity. It provides a good FFT function, and a spectrogram function. It’s also a good general purpose audio editor.
I’ve used it a bunch in work.
You might need to export your raw data files into a format the program recognizes, like .wav
Stan
Hi Stan – I thought about frequency. And I looked for a good way to do FFT in Excel (so that I wouldn’t have to buy Matlab).
In the end, I decided to abandon that approach because I think I would have a hard time explaining it to a mass audience on video. You and some others would have understood, but likely not everyone.
I may do it just to broaden my own horizons though.
I appreciate your nerdy analysis more than you know. Thanks for sharing!
Thanks, Candy!
OMG. You are such a geek and I totally think I love you. (Kidding, of course. Love you too Stephanie) Watching for awhile now and fun to watch and great information. Keep the videos coming.
We love you back, Becky! 😉
Interesting. I would like to see an absolute difference plot. Also why not do a simple fourier transform from the time domain to the frequency domain. After that is is east to apply filters and then back transform to time. Hmm might be a little tricky working in a spread sheet though :<).
Yeah, I’m sure you won’t be the only one to suggest the FFT. The analysis software was one holdup. Being able to explain what I was doing to the general public was another.
Wow, quite an analysis James! Very interesting. Need to call Michael back and run it again now that he’s got his Sumo’s installed. We noticed a definite reduction in that rebounding effect as soon as ours were installed on our K.
Well, the REAL thing to do would have been to do this in Lance both before and after. Lance had Sumos.
Ah, hindsight…
If only I had NEXT FRIDAY’s Wall Street Journal today! But, I would be interested in the difference between your install and the Sumo Bump Stops.